Introduction
FalconPro Real Estate Software offers powerful data visualization tools through its Falcon Charts feature, enabling users to turn property, financial, and operational data into interactive, easy-to-read charts. With Falcon Charts, users can generate visual reports directly from any module—such as leasing, receipts, and payment vouchers—by simply retrieving data and selecting chart parameters. This guide explains how to create, customize, and manage charts in FalconPro Real Estate Software for better decision-making and analysis.
Understanding Falcon Charts
Falcon Charts is an integrated reporting feature that converts raw data into dynamic visual presentations. It allows property managers, accountants, and administrators to:
-
Visualize data in pie, column, or bar chart formats.
-
Compare performance across buildings, periods, or user categories.
-
Export or print visuals for reports and presentations.
This functionality is ideal for businesses using real estate software solutions to simplify complex datasets and monitor KPIs.
Getting Started with Falcon Charts
To begin using Falcon Charts in FalconPro Real Estate Software, ensure your software version is 25.07 or newer. You can generate charts in any module window: leasing contracts, receipts, payable invoices, or check management.
Steps to access charts:
-
Open the desired module window and retrieve relevant data.
-
Click the “Charts” button to open the chart interface.
-
If charts already exist, they will appear in a list; otherwise, select “New Chart.”
You need two columns to build a chart: one for the labels (e.g., building name or category) and one for the data (e.g., amount or contract count).
Creating Your First Chart
To create a chart, follow these steps:
-
Choose Label and Data Columns:
Select a label column (e.g., property name, building, date) and a data column (e.g., collected amount, balance, count of contracts). -
Select the Calculation Type:
Choose whether you want to display a sum or count value depending on the data (e.g., number of contracts or total collected rent). -
Pick a Chart Type:
-
Pie chart for distribution visualization (e.g., commercial vs. residential contracts).
-
Column chart for time-based comparisons (e.g., monthly receipts).
-
Bar chart for comparing data across multiple entities (e.g., supplier invoices).
-
-
Customize Colors and Style:
Modify colors or switch between 2D and 3D views for better presentation.
Once completed, click “Save” to add your chart to the list for future access.
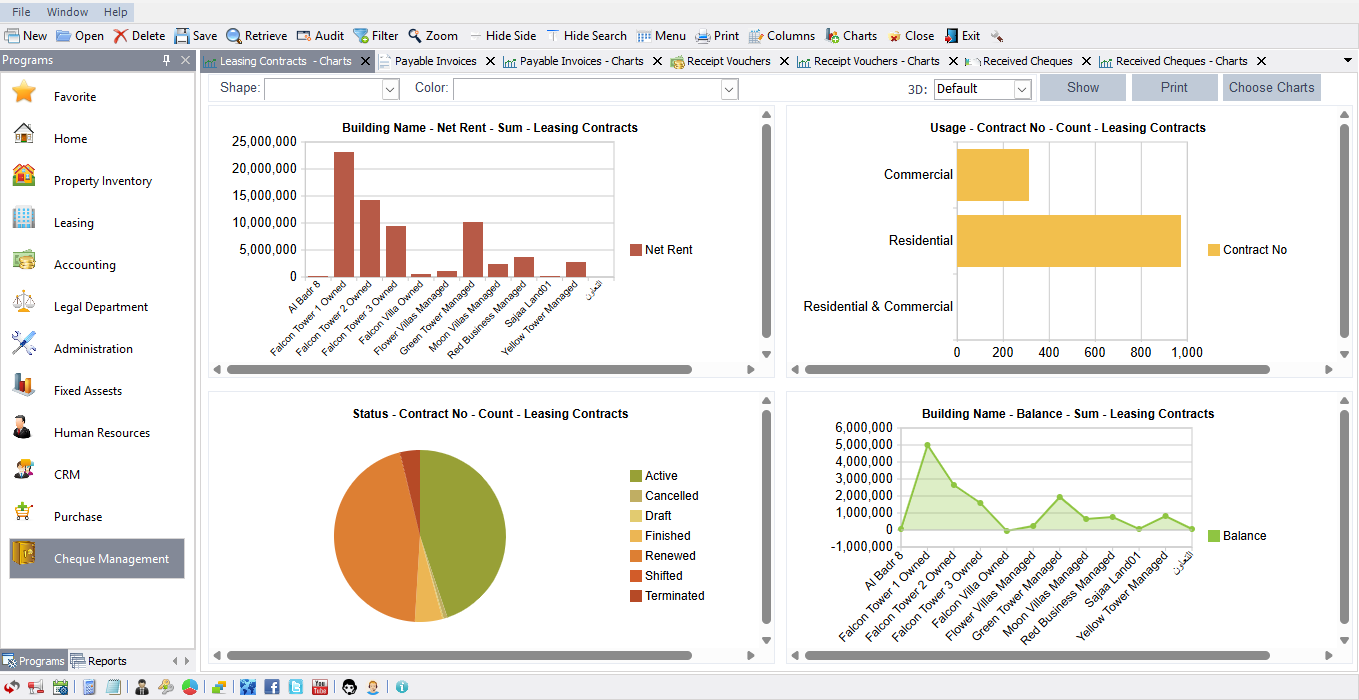
Example: Building-Wise Chart Creation
Suppose a user wants to analyze rent balances per building:
-
Open the Leasing Contracts window.
-
Choose Building Name as the label column.
-
Choose Balance or Collected Amount as the data column.
-
Select the Pie Chart type to represent the proportion of each building’s rent totals visually.
-
Save the chart—FalconPro will now display building totals in an easy-to-read format.
This example helps real estate professionals who use property management software to analyze financial performance across multiple assets efficiently.
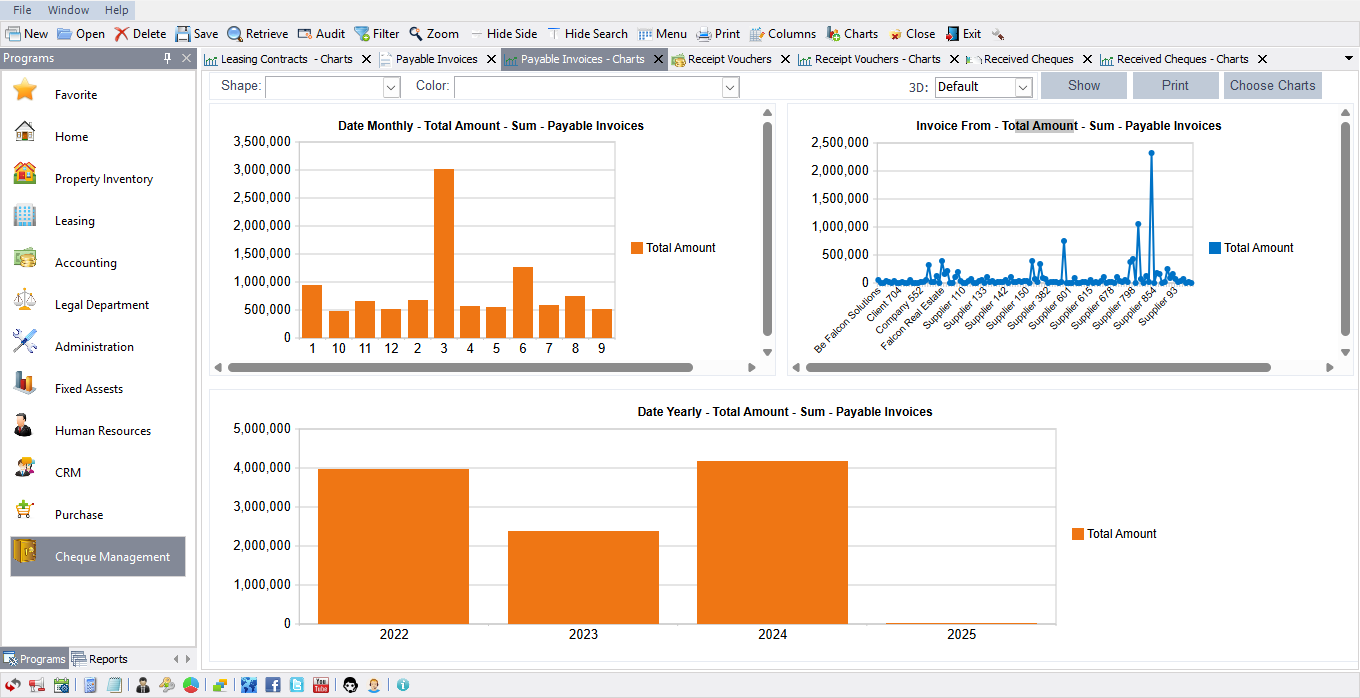
Enhancing Financial Reports
FalconPro Real Estate Software’s Falcon Charts also integrate seamlessly with accounting modules. For example:
-
Supplier-Wise Payable Analysis: Generate charts showing payable invoices by supplier and total amount.
-
Monthly Invoice Trends: Retrieve yearly data to display monthly invoice totals for performance tracking.
-
Accounts-Based Analysis: Visualize expenses and revenues assigned to various accounts for better financial management.
These charts allow decision-makers to monitor expenses, identify discrepancies, and streamline operations using robust ERP software Dubai businesses trust.
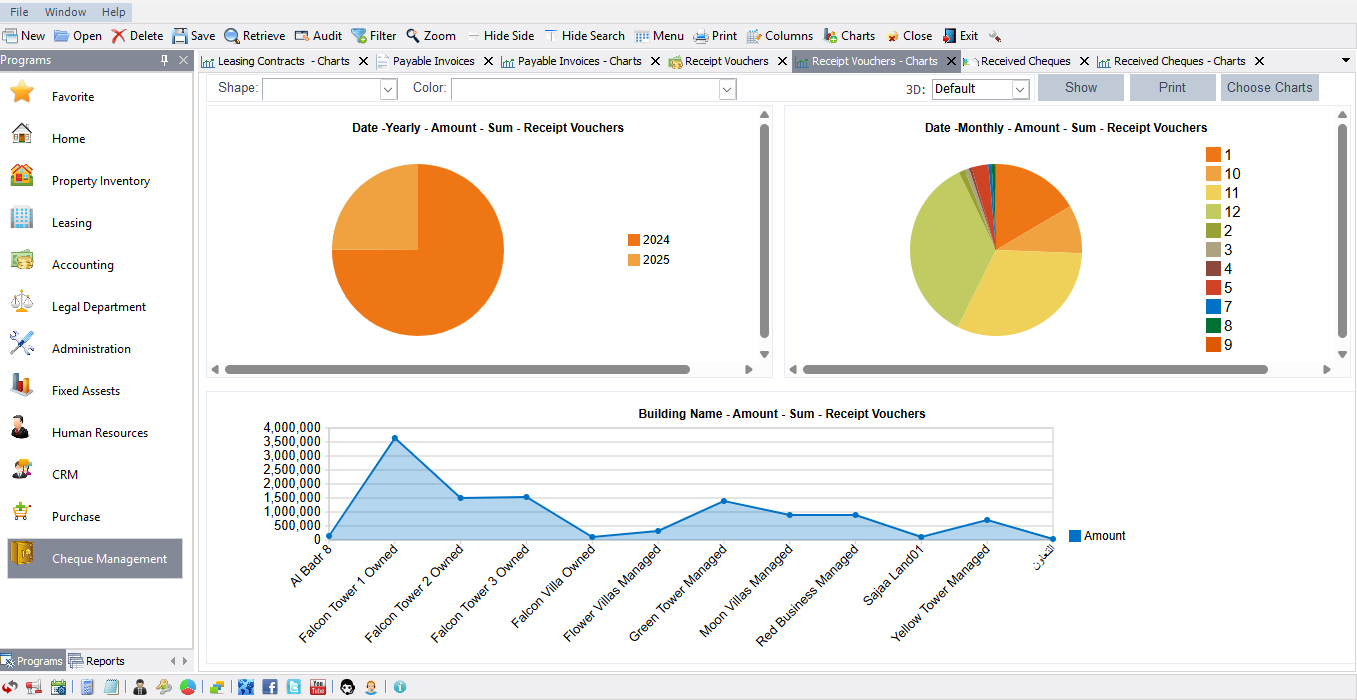
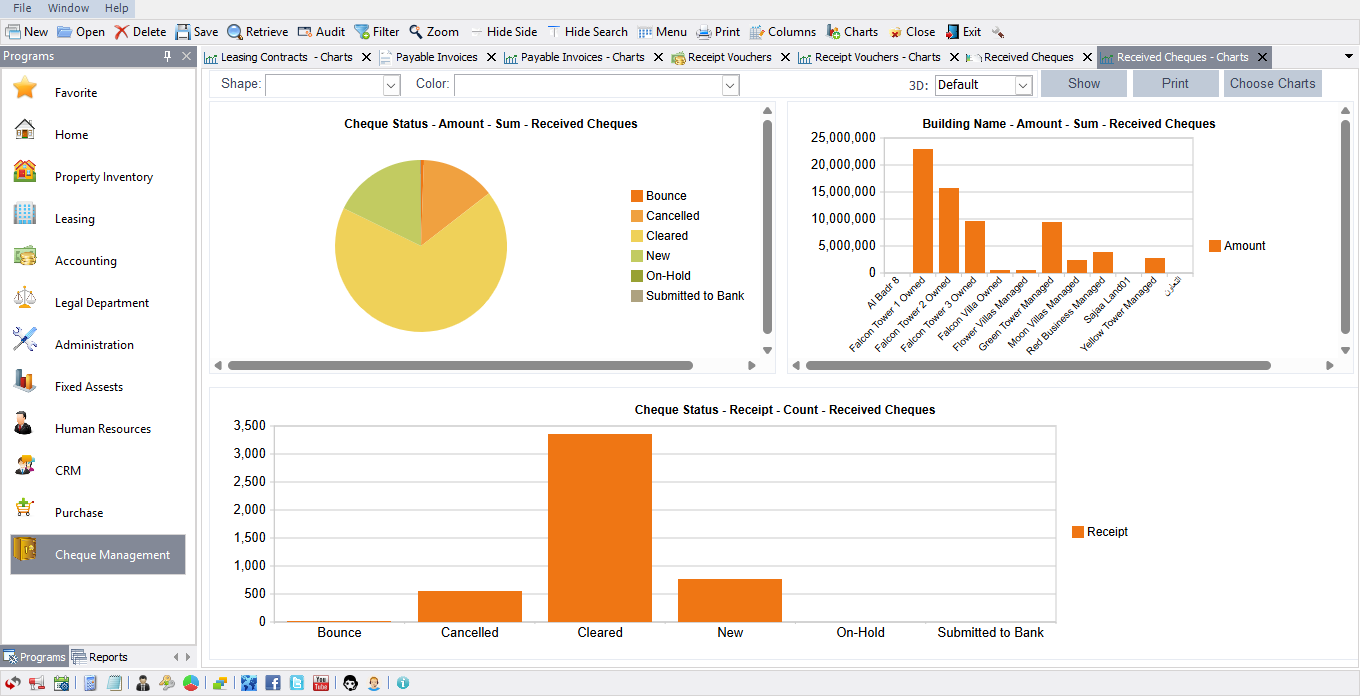
Chart Filtering Options
Filters make Falcon Charts even more powerful. Users can:
-
Filter data by date range (daily, monthly, or yearly).
-
Select specific statuses (e.g., active vs. canceled contracts).
-
Limit data to specific categories (e.g., new, submitted, or cleared checks).
After applying filters, click “Refresh” to update the visualization dynamically.
Managing and Editing Charts
In addition to creating new charts, FalconPro allows users to copy or modify existing charts easily.
-
Use Edit to change the selected columns or chart type.
-
Use Copy to create similar charts with adjusted conditions or data filters.
-
Only authorized users (as assigned by the administrator) can add, delete, or modify charts for system security.
Exporting and Sharing
Charts can be printed or exported for reporting purposes. Common export options include screenshots or image files suitable for presentations or client reports. This feature is particularly useful for professionals managing multiple real estate projects who require visual summaries for stakeholder updates.
Benefits of Falcon Charts
Falcon Charts deliver significant advantages for data-driven professionals:
-
Improve decision-making through intuitive visuals.
-
Enhance transparency across departments.
-
Reduce manual reporting time.
-
Enable customized visualization of financial, property, and operational data.
FalconPro Real Estate Software ensures that these charting capabilities support organizations in managing real estate more efficiently.
Conclusion
Falcon Charts empower users of FalconPro Real Estate Software to turn complex data into actionable insights. By customizing visual dashboards across leasing, accounting, receipts, and check modules, businesses can streamline reporting, enhance accuracy, and visualize performance trends effortlessly. Whether you need building-wise breakdowns or supplier-based audits, Falcon Charts is an indispensable tool for professionals using real estate software solutions in the UAE.
FAQ
-
What are Falcon Charts in FalconPro Real Estate Software?
Falcon Charts are built-in visualization tools that turn data from any module into graphical reports such as pie, bar, or column charts. -
Which modules support Falcon Charts?
All modules, including leasing, receipts, check management, and accounting, support charts creation. -
Can I customize the appearance of charts?
Yes, you can select 2D or 3D styles, colors, and chart types according to your preferences. -
Can I export or print my charts?
Absolutely. Charts can be exported or printed for easier sharing and presentation. -
Do I need admin permissions to create charts?
Only authorized users can create, edit, or delete charts, as controlled by admin settings.
Important Links
Introduction to VAT Registration in the UAE
Federal Tax Authority – Guides, References & Public Clarifications
